Survey Highlights
Based on My Health My Community Survey 2014,
from 33,000 respondents across the BC Lower Mainland
The survey asked people, aged 18 and up who live in the Vancouver Coastal Health and Fraser Health regions, to provide information about their health, lifestyle choices, community involvement and neighbourhood characteristics.
Survey areas of focus:

Health Status
General Health
Excellent or Very Good
Metro Vancouver
Fraser Valley
Coastal Rural
By age group
(all regions)
18-39
53%
40-64
48%
65+
41%
By gender
(all regions)
Female
Male
Mental Health
Excellent or Very Good
Metro Vancouver
Fraser Valley
Coastal Rural
By age group
(all regions)
18-39
56%
40-64
57%
65+
60%
By gender
(all regions)
Female
Male
Diabetes
In Metro Vancouver
Of total population
By Age Group
18-39
2%
40-64
9%
65+
18%
By Gender
Female
Male
Mood or Anxiety Disorders
In Metro Vancouver
Of total population
By Age Group
18-39
16%
40-64
19%
65+
8%
By Gender
Female
Male
Obesity and grocery access
People living in Richmond neighbourhoods with a healthier retail food environment, such as access to grocery stores or green grocers, are 43% less likely to have an overweight or obese body mass index.
Of Metro Vancouver adults have an obese body mass index (≥30)
Obesity Rates
Body Mass Index (BMI) ≥ 30
Powell River
37.9%
Chilliwack
36.7%
City of Langley
35.8%
Fraser Valley
33.7%
Mission
32.9%
Maple Ridge
32.8%
Abbotsford
32.5%
Hope
32.0%
Sechelt
31.7%
Port Coquitlam
31.6%
Pitt Meadows
31.1%
Township of Langley
29.0%
Rural Sunshine Coast
28.6%
Surrey
28.1%
Coastal Rural
26.9%
New Westminster
26.8%
Delta
26.6%
Bowen Island
22.8%
Gibsons
21.9%
Metro Vancouver
21.7%
South Surrey / White Rock
21.7%
City of North Vancouver
21.1%
Squamish
21.1%
Coquitlam
21.0%
District of North Vancouver
20.0%
Burnaby
19.2%
West Vancouver / Lions Bay
19.0%
Port Moody
17.3%
Richmond
16.9%
Vancouver
15.2%
Whistler
14.2%
Lifestyle
Fruit & Vegetable Consumption
In Metro Vancouver, 5+ Servings Daily
Of total population
By Age Group
18-39
25%
40-64
24%
65+
26%
By Gender
Female
Male
Less screen time
is linked to a stronger sense of community belonging
of Metro Vancouver adults report 2+ hours of screen time
Smoking prevalence across education groups
In Metro Vancouver
Less than high school graduation
22%
High school graduation
13%
Certificate or diploma below bachelors level
10%
University Degree
4%
Proximity to alcohol
Compared with those who live within 250 m of liquor stores, people who live over 1 km away have 45% lower odds of binge drinking.
of Metro Vancouver adults binge drink one or more times per month
Highest Level of Physical Activity
150 minutes or more per week
Squamish Residents
Whistler Residents
West Vancouver / Lions Bay
Food Insecure
Sometimes or often in the past 12 months
Richmond
6.3%
Vancouver
8.5%
Coastal Urban (including North Vancouver, West Vancouver, Bowen Island)
5.1%
Coastal Rural (including Squamish, Whistler, Sunshine Coast, Bella Bella, Bella Coola)
4.1%
Fraser East (Abbotsford, Chilliwack, Hope, Mission)
4.9%
Fraser North (Burnaby, New Westminster, Coquitlam, Maple Ridge)
6.4%
Fraser South (Delta, Surrey, Langley)
6.7%
Primary Care Access
Having a Family Doctor
As age increases, the odds of having a regular family doctor increases as well.
Built Environment
Neighbourhood Walkscore®
and Residents Walking 30+ Min/Day
As Walkscore®* increases, a greater proportion of residents meet the daily walking recommendations for a healthy lifestyle.
*Measure of distance to nearby amenities such as grocery stores, schools, parks, restaurants, and retail.
Amenities are within walking distance of my home
Strongly or somewhat agree
City of North Vancouver
87.4%
New Westminster
82.3%
Vancouver
81.5%
City of Langley
74.1%
Metro Vancouver
69.5%
South Surrey / White Rock
68.7%
Richmond
68.5%
Delta
65.8%
Burnaby
65.1%
Pitt Meadows
65.1%
Surrey
63.8%
West Vancouver / Lions Bay
63.3%
Whistler
62%
Township of Langley
61.7%
District of North Vancouver
61.2%
Port Coquitlam
59.1%
Coquitlam
58.8%
Gibsons
57.1%
Squamish
56.9%
Port Moody
56.8%
Abbotsford
52.4%
Chilliwack
51.3%
Maple Ridge
48.9%
Fraser Valley
48.8%
Hope
47.6%
Coastal Rural
44.6%
Sechelt
40.4%
Powell River
36.6%
Bowen Island
32.9%
Mission
32.2%
Rural Sunshine Coast
13.1%
Highest proportion of residents who
walk, cycle or take transit to work

New Westminster
Vancouver
Burnaby
Commute time and community belonging among car users
Less time in your car = more time with your community
Sense of community belonging dereases with increasing commute time – those with a commute time of more than 50 minutes are 56% less likely to experience a strong sense of community belonging than those with a commute time of less than 10 minutes.
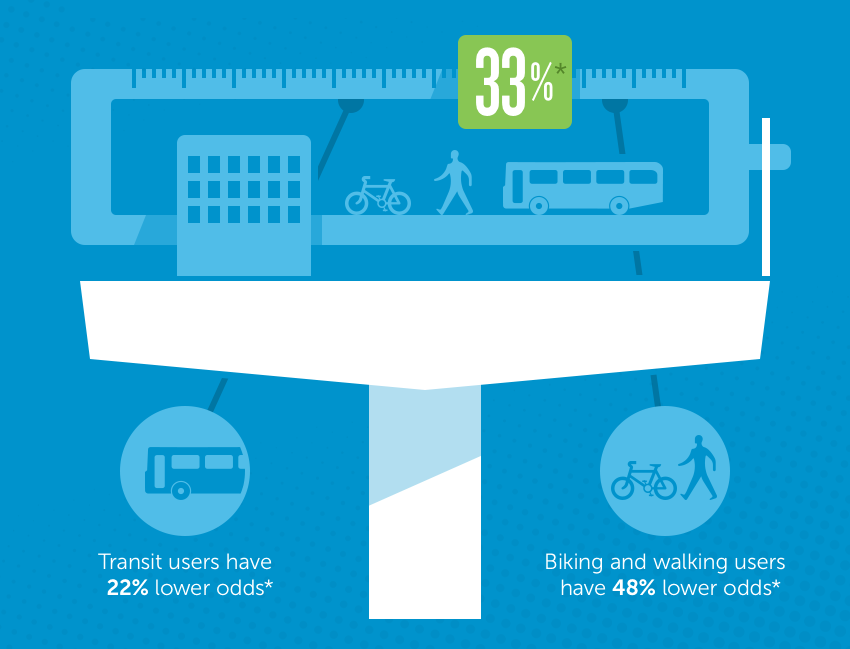
Using active modes of transportation for commuting decreases the odds of being overweight or obese by 33%
Transit users have 22% lower odds and those who bike or walk have 48% lower odds
Exposure to second hand smoke in public places across income groups
Community Resiliency
Highest proportion of residents
who have enough emergency preparedness supplies for 3 days or more
Bowen Island
Rural Sunshine Coast
Sechelt
Association between sense of community belonging and perception of health
Social Isolation
Aged 18+ Years
Richmond
6.3%
Vancouver
6.3%
Coastal Urban (including North Vancouver, West Vancouver, Bowen Island)
4.6%
Coastal Rural (including Squamish, Whistler, Sunshine Coast, Bella Bella, Bella Coola)
3.2%
Fraser East (Abbotsford, Chilliwack, Hope, Mission)
5.7%
Fraser North (Burnaby, New Westminster, Coquitlam, Maple Ridge)
5.8%
Fraser South (Delta, Surrey, Langley)
7.6%